
The following multi-part question, explained here in hopes of helping algebra students in Maryland and Illinois prepare for the PARCC test near the end of this school year, appears on the released version of PARCC’s Spring 2016 test in algebra 1 (#7), here:
The parabola  is graphed in the xy-coordinate plane.
Part A
What is true about the vertex of the parabola?
- It is 2 units to the left of the origin and 1 unit down from the origin.
- It is 2 units to the right of the origin and 1 unit up from the origin.
- It is 2 units up from the origin and 1 unit to the right of the origin.
- It is 2 units down from the origin and 1 unit to the left of the origin.
Part B
How does the graph of the function  compare to the graph of
 has a vertical shift 3 units up from
 - has a vertical shift 3 units down from
- has a horizontal shift 3 units to the right of
- has a horizontal shift 3 units to the left of


For Part A, where’s the vertex?
Play it safe: write the polynomial in the form ax2 + bx + c and use the (h, k) formula.
You could also graph it in the coordinate plane, since you have access to a graphing calculator during the algebra 1 test:
But it takes too much time to punch it in, and the PARCC test has a time limit for most students. Let’s just cut to the chase, whad’dya say? Just multiply it out:


Knowing this might come in handy, as the quadratic is now expressed in a standard form.
Where’s the vertex?
For a given quadratic function  , the vertex (h, k) can be found by first defining the x-coordinate to be

and then evaluating the original function at x = h to find k. Remember, the polynomial for the function must be expressed in standard form. For our quadratic, as we found above, in the general form:
- a = +1
- b = –4
- c = +5
That computes to h = 4 ÷ [(2)(1)] = 2. Then we evaluate the function at x = 2 and get the y-coordinate for the vertex.


So, at x = 2, y = 1, and we know the vertex of the parabola is at (2, 1).
Shaped like a “∪” or like a “∩”?
Any function in x that has the x squared is going to be a parabola. It will open up if the quadratic term (the x-squared term, or a in the standard form) is positive and it will open down if the quadratic term is negative. One way to remember this is that if you’re feeling positive, you have a smile on your face, and if you’re feeling negative, you have a frown, which makes your mouth the shape of a “∩.”
In the Part A problem, the x-squared term has a coefficient of +1. That means the parabola will open up and be shaped like the letter U. You are not asked about the shape, just the location of the vertex, but I just wanted to cover some other stuff.
Part B is about function transformations
Use reasoning to figure out what will happen to the graph.
Before I begin, let’s just remember that changes to functions where a constant is grouped inside the parentheses of f(x), such as f(3x) or f(x + 2), require you to do the inverse of the operation in transforming the graph. That’s because you have to start with the transformed function and get back to the original when making your comparison.
For example, when I’m comparing f(x + 3) to f(x), I’m going to subtract 3, because I added 3 to get from the original function to the transformed function. Just keep this in mind as we go.
Skinny or fat?
The coefficient on the quadratic term tells you the basic shape of the polynomial. If it’s a small number (positive or negative), the parabola will be spread out, and if the absolute value of the coefficient on the quadratic term is very large, the parabola will be narrow:
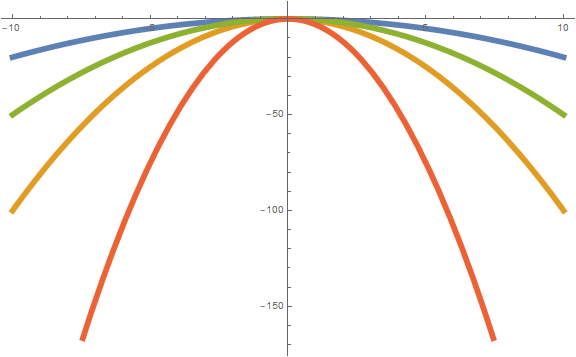
Graphs of –3x2 (red), –x2 (orange), –0.5x2 (green), and –0.2x2 (blue).
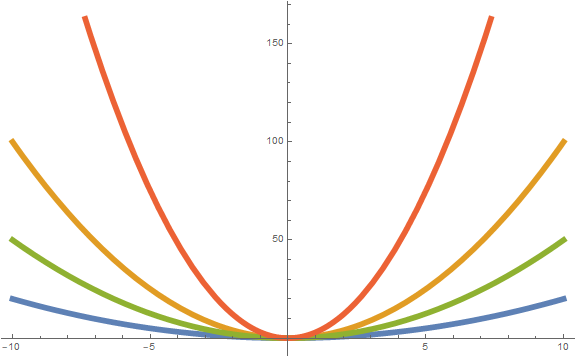
Graphs of 3x2 (red), x2 (orange), 0.5x2 (green), and 0.2x2 (blue).
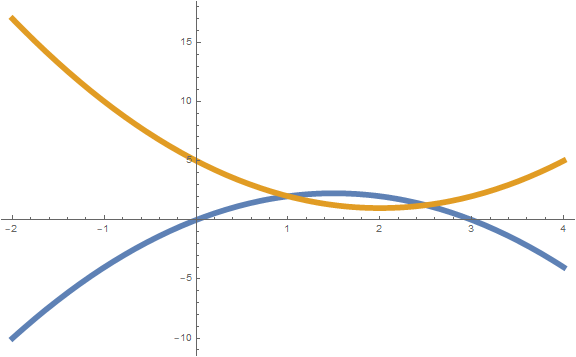
In Part B, you are asked to consider the same function, f, at a point that is three units to the right of the original function. Since the constant is grouped inside the parentheses (on the left side), to translate the function, you have to do the opposite operation: subtraction, since the 3 is added to the x. The value of any given function f at a point that is three units to the right (i.e., at x+3) will be three units to the left of the original.
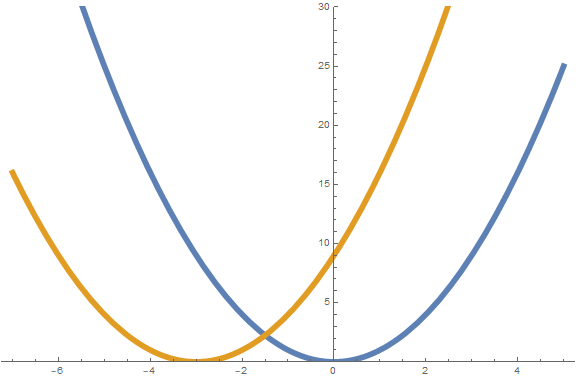
Graphs of f(x) = x2 (blue) and f(x+3) (orange)
As shown on the graph, the y value for the point x = 0 for a basic parabola, shown in blue, is at (0, 0). In order to get the same value for y on a function that is evaluated at x = 0 + 3, we would have to subtract 3 units from that x value and evaluate the function at that point. That’s why this is always the reverse direction: it’s like we’re operating on the input instead of changing the output of a function.
So, that covers this question, but the Common Core standards, on which the standards in both Maryland and Illinois are based, actually expect a little more from students. That means, Part B for this question could have asked about several different function transformations.
Translate to the right or left
Replacing f(x) by f(x + k) will shift the graph of the function to the right (if k is negative) or to the left (if k is positive). In fact, it will move the function by exactly k units to the right or left. This is what was shown in Part B on this PARCC question.
Translate up or down
Replacing f(x) by f(x) + k will shift the whole graph up (if k is positive) or down (if k is negative). The translation will be by exactly k units. Note that, unlike evaluating the function at x+3, here we are evaluating the function at the original x value and then adding (or subtracting) something (k). So when the constant occurs outside the x grouping, you don’t use the inverse operation when translating the graph of the function.
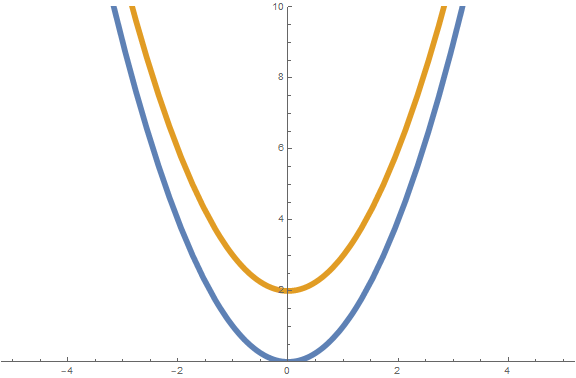
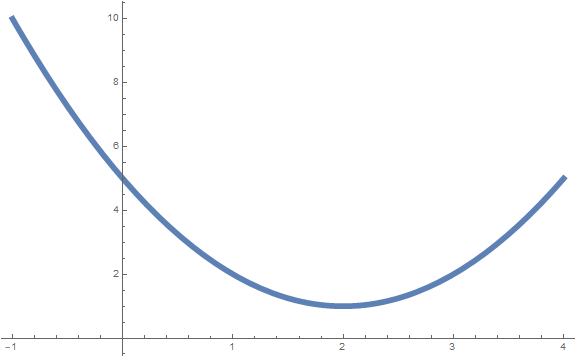
Graphs of f(x) = x2 (blue) and f(x) + 2 (orange)
Make skinnier or fatter
The same logic applies if we replace f(x) by k f(x). We’re not, in this case, evaluating the function at a different value of x, but we’re simply taking the value of the function and multiplying it by some constant k. If the absolute value of k is less than 1, we will move every point on the graph closer to the x axis, whereas if it’s greater than 1, we’ll move every point (except 0) farther away from the x axis.
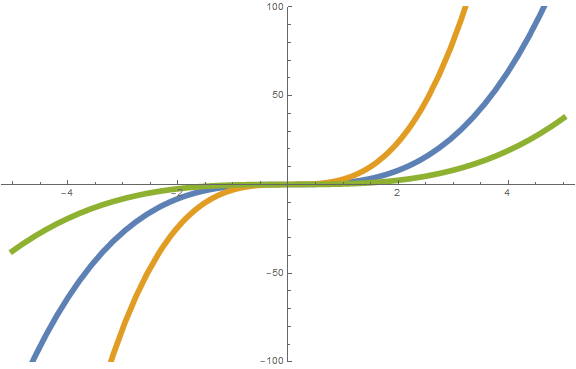
Graph showing f(x) = x3 (blue), 3 f(x) (orange), and 0.3 f(x) (green)
If k is negative, you can think about it like this:
- Figure out what the graph would like like if k were positive instead of negative.
- Reflect the resulting graph from step 1 across the x-axis.
If we replace f(x) by f(kx), the situation changes a little, but the same principle of skinner or fatter applies. Except now, we’re evaluating the function at a different x value, not simply changing it after we evaluate it. So we once again have to use the inverse operation, which, in this case, is division.
We’re multiplying in this case, not adding as we were with the shifts left and right above, but as with the left and right shifts, scaling like we’re doing here is always the inverse of what it appears to be.
That is, we would need to divide every x-coordinate by k and leave the y-coordinates on the graph unchanged. And grouping the constant with the x means we’re going to change the graph to make it skinnier or fatter based on the y-axis: the graph will move closer to the y-axis when the absolute value of k is greater than 1 and farther away from the y-axis when the absolute value of k is less than 1.
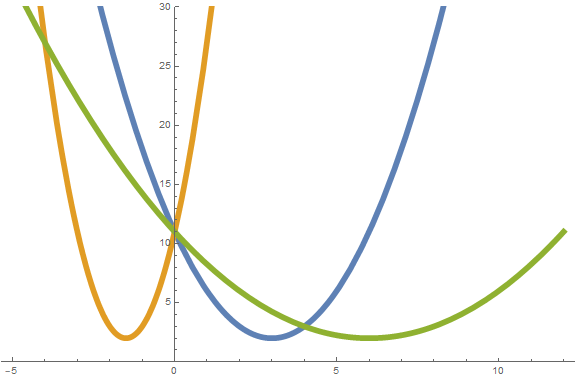
Graphs of f(x) = (x–3)2 + 2 (blue), f(–2x) (orange), and f(0.5x) (green)
The key above is that for the orange graph, f(–2x), you can first think of it as plotting f(2x) to get the general shape of the graph in terms of how skinny or fat it is and then reflecting that graph, which would be skinnier than the graph of f(x), across the y-axis. The negative sign on the coefficient means a reflection across the y-axis.
Online resources for further study
- Purple Math by Elizabeth Stapel
- Khan Academy on Finding Vertex of a Parabola
- Algebra 1 at Richland Community College in Decatur, Illinois
Analysis of this question and online accessibility
The question measures knowledge of part of the Common Core standard it purports to measure and tests students’ ability shift, translate, and stretch the graph of a parabola on the coordinate plane.
The question can be tested online and should yield results that are as valid and reliable as those obtained on paper. In addition, no special accommodation challenges can be identified with this question, so the question is considered fair.
However, the multiple-choice format adds unnecessarily to the reading load for the question, given that other presentation options are available in an online format. The question is equivalent online in that the paper-and-pencil version of this item will be identical to the online version, but since more than 90 percent of students take the test online, at least in Maryland, a better presentation option would have been more appropriate here.
Furthermore, multiple-choice options like this, where all but one or two words are identical, can confuse students who have a reading disability. Especially in Part B where the order of the vertical shift and horizontal shift is different in options C and D from what it was in options A and B (this is done to conform to a convention in multiple-choice options that present them in two pairs of two options), the re-reading of nearly similar answer options can be confusing. It’s not terrible here, though, since the answer options are just one line each, but if they include more than one sentence, other options for presentation should be explored.