Nationally, eighth graders’ average scores on the US history, geography, and civics tests, administered in 2014 as part of the National Assessment of Educational Progress, sometimes called the Nation’s Report Card, showed no significant change compared to 2010, the last time US eighth graders were tested on these subjects for the NAEP.
However, several student groups made gains. In 2014, 18 percent of eighth graders performed at or above the Proficient level in US history, 27 percent performed at or above the Proficient level in geography, and 23 percent performed at or above the Proficient level in civics.
Students performing at or above the Proficient level on NAEP assessments demonstrate solid academic performance and competency over challenging subject matter.
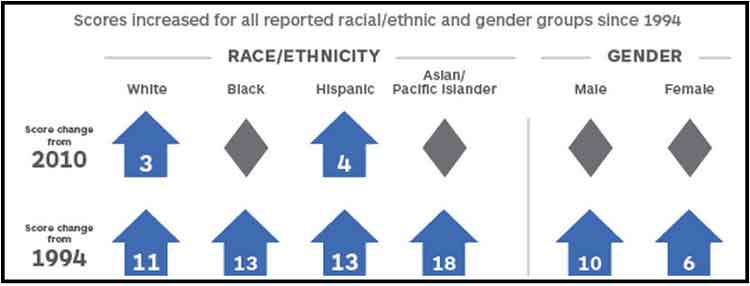
If the 2014 results are compared to 1994, though, students have made statistically significant gains in social studies, as measured by the NAEP tests. For example, scores on the test in US history for boys, girls, whites, blacks, Hispanics, and Asians/Pacific Islanders all went up in a statistically significant way, compared to 1994.
The same can’t be said for geography, in which scores increased for only whites, blacks, and Hispanics—and only by a few percentage points for whites.
NAEP started testing civics in 1998, and scores for white, Hispanic, and male students have increased since the first test in civics.
Resources
NAEP has released a few sample questions used on last year’s social studies tests. They’re shown in descending order of difficulty, using what are known as “performance level descriptors.” This means, a student with a score of X should have a proficient understanding of subject N. Students who score in the “Advanced” range should be able to answer more difficult questions than students whose scores fall in the “Basic” range.
For example, on the civics test, a student who scored 229, which is Advanced, would be able to identify presidential responsibilities not in the Constitution, while a student who scored 149, a Basic-level score, would not. That student would be able, however, to interpret a pie chart that presents information or data about population demographics in the US.