
The following multi-part question, explained here in hopes of helping algebra students in Maryland and Illinois prepare for the PARCC test near the end of this school year, appears on the released version of PARCC’s Spring 2016 test in algebra 1 (#28), here:

Spicy bean tortillas with corn salsa and avocado
A local salsa company makes two types of salsa, tomato and corn. Each batch of tomato salsa takes 2 hours to prepare and 4 hours to package. Each batch of corn salsa takes 2.5 hours to prepare and 3 hours to package. There are 4 preparation workers and 7 packaging workers in the company. Each of them works 40 hours per week.
Part A
Create a system of two inequalities that relates the number of batches of tomato salsa, t, and the number of batches of corn salsa, c, that can be made by the 4 preparation workers and the 7 packaging workers each week. Assume t > 0 and c > 0. You must select two inequalities.
- 2t + 2.5c < 160
- 2t + 4c < 160
- 2t + 4c < 280
- 2.5t + 3c < 160
- 4t + 3c < 160
- 4t + 3c < 280
Part B
Which combinations of batches of salsa could be made in one week based on the constraints?
Select all that apply.
- 20 tomato and 45 corn
- 30 tomato and 40 corn
- 45 tomato and 30 corn
- 50 tomato and 25 corn
- 60 tomato and 10 corn
Part C
In order to maximize productivity, how many batches of salsa should be made if the company owner wants 20 batches of corn salsa?
Part D
The company owner decides to only make corn salsa one week prior to a local festival. Given the same constraints, what is the maximum number of batches of corn salsa that can be made in one week?
For Part A, if the company is producing both corn and bean salsa, we first consider just the production of the workers who make salsa: 2 hours for tomato, and 2.5 hours for corn. There are 4 workers making salsa (the other 7 package the salsa). Then, since each of those 4 workers puts in a 40-hour week, the total number of work hours they devote to making salsa each week is 160 (4 × 40).

The packaging takes longer for some reason: 4 hours for tomato salsa and 3 hours for corn salsa:

So those are the two inequalities that describe this company’s salsa production. If we consider these inequalities as a system of two inequalities in two unknowns, we can solve it.
Use a graph to plot the inequalities and check the boundaries. In the graph below, I plotted the two inequalities:
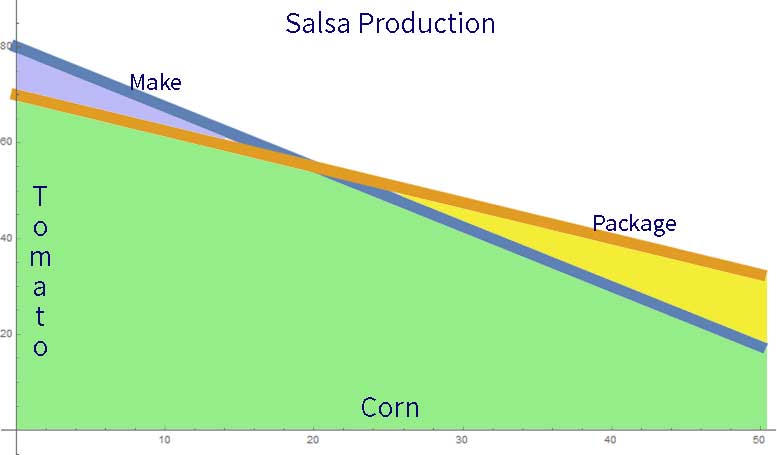
In this graph, the blue line (which should be dotted, because it’s an inequality) represents the maximum number of salsa batches the company’s four workers can make in a week, described by the first inequality in Part A.
The orange line represents the maximum number of salsa batches the company’s seven packagers can, well, package in a given week.
For the graph, the number of corn salsa batches is plotted along the x axis, and the number of tomato salsa batches along the y axis. To see this, just assume the company’s four makers don’t make any corn salsa and instead devote all their time to making tomato salsa. Since each batch of tomato salsa takes two hours to make, the graph should go through the point (0, 80), which makes it the blue line.
Likewise, if the company’s seven packagers devoted all their time to packaging the tomato salsa, they could only package 70 batches, since they work a total of 280 hours each week and it takes them four hours to package each batch of tomato salsa. The graph for the packagers, then, goes through the point (0, 70).
The half-plane in the region below each line is shaded, because the line represents the maximum amount of tomato and corn salsa that can be made or packaged. I have shaded the region for the makers in light blue, the region for the packagers in yellow, and the overlapping region that satisfies both the makers and the packagers in light green, since that’s the color that gets made when you combine light blue and yellow regions.
It is logical that the company’s production in any given week will be restricted to the green region, because any point outside the green region (above one or both lines) would be impossible, since the workers don’t work enough hours in a week to make or package that number of batches.
So that logic brings us to Part B. In addition to using the graph to determine whether or not a point is in the green region, we can also use an algebraic solution. The two lines are represented by the inequalities:
Since both inequalities are satisfied, option (A) works. Continue for the remaining options. For example, when looking at option (D), you can see that the point (50, 25) is in the yellow region of the graph.
What does the yellow region represent? It’s the number of batches of corn and tomato salsa that can be packaged but not made (it’s above the blue line).
Since the point (50, 25) is in the yellow region, that means the makers wouldn’t be able to make 50 batches of corn salsa (125 hours) and 25 batches of tomato salsa (50 hours). In other words, 175 hours to make, which is not good, since those four people only put in a total of 160 hours. That many batches could be packaged, though (200 hours for the corn, 75 hours for the tomato, or 275 total hours, just less than the 280 those workers put in).
For Part C, we have to consider what is called a boundary condition. That is, at maximum production (the actual line on the graph), what’s the highest number of tomato salsa batches that can be produced (remember, the green region means it can be produced) if 20 batches of corn salsa are produced (the x axis represents the corn).
As you can see from the graph if you draw a vertical line up from 20 on the corn salsa axis, the vertical line intersects at about the point where the two lines intersect. This point of intersection is actually going to be the solution to any problem that asks you to “maximize” the production. All we need to do is determine where the two graphs intersect.
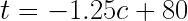
The line for the makers is given by
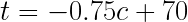
And the line for the packagers is given by
The number of batches of tomato salsa, t, at the point of intersection is the value of t when c = 20:


Part D is a little tricker, I guess, but it stipulates that the company will make only corn salsa. If it will make only corn salsa, that means the value of t in all our equations, which represents the number of batches of tomato salsa in a given week, is 0.
On the graph, can you imagine where that point would be? The t axis (the y axis) has to be 0, which doesn’t happen until all the way to the right. That means, since I only plotted it out to 50 corn salsa, that it’s going to be more than 50.
Also, I can see from the graph that the limiting factor is going to be the number of batches that can be made (the line for the packagers is always going to be higher than the line for the makers once we get above c = 20).
That means I have to use the equation for the makers, which is different from the one I used to demonstrate the solution strategy for Part C. Wherever the line for the makers hits the c (x) axis is going to be the maximum number of batches of corn salsa can be made in the week, given that we’re not going to make any tomato salsa (t = 0 for all points on the c axis).


Analysis of this question and online accessibility
The question measures knowledge of the Common Core standard it purports to measure and tests students’ ability model a real-world system using systems of two equations or inequalities in two unknowns. It is considered to have a median cognitive demand.
The question can be tested online and should yield results that are as valid and reliable as those obtained on paper. In addition, no special accommodation challenges can be identified with this question, so the question is considered fair.