
The following constructed-response question, explained here in hopes of helping algebra 2 students and their parents in Maryland prepare for the PARCC test near the end of this school year, appears on the released version of the PARCC Algebra 2 sample items released following the 2015 test.

The arrangement of a distribution center and four stores to which it delivers is shown on the grid. Each unit on the grid represents 5 miles. The grid lines represent the roads.

The distribution center operators will use a single vehicle and must decide between a large truck and a small van. They will base their decision on this information.
Large Truck
- fuel efficiency: 9 miles per gallon
- delivers to all stores in one round-trip
- uses the shortest route to go to Stores A through D and then back to the distribution center
- must pay a $3.00 fee at each store for using the loading dock
Small Van
- fuel efficiency: 18 miles per gallon
- must return to the distribution center after delivery to each store
- uses the shortest route between the distribution center and each store
- no fee for using the loading dock
Part A
Create a model that shows the total cost to deliver to all the stores for each type of vehicle based only on the information provided. Justify your models, including any assumptions you made.
Enter your models and your justifications in the space provided.
Part B
Determine when it is more cost efficient to use the van for deliveries than it is to use the truck. Justify your answer.
Enter your answer and your justification in the space provided.
Part A: Create a mathematical model by determining how many miles each delivery vehicle will travel to make the deliveries, divide by the fuel efficiency, and add any extra charges.
The small van has to make a return trip to the distribution center after each store. The relevant distances are therefore the distance between the distribution center and each store. The distance from the distribution center to each store is shown here (one-way). Note: The truck has to drive on the roads indicated and can’t cut straight across as the crow flies.


Thus the small van will have to travel a total of twice (round-trip) the sum of 15 + 25 + 25 + 15, or 160 miles. It gets 18 miles per gallon, so it will use a little under 8.9 gallons of gas for the delivery runs.
The large truck, on the other hand, can just go around the block. Its distance to store A, then B, then C, then D, and back to the distribution center (it doesn’t matter which way it goes), comes to the distance between each point:

That is, it will only have to travel 60 miles to hit each store and then return to the distribution center. With a fuel efficiency of 9 miles per gallon, it will use about 6⅔ gallons of gas. However, this truck will also have to pay a docking fee at each of the four stores of $3, bringing a total addition to the cost for using the large truck of $12.
To figure out which delivery vehicle would actually be cheaper, we would need to know the price of gas, but we aren’t asked that in part A (it’s coming). All we were asked to do in part A was to create a model and justify it. That we have done.
Part B: Use the models created above and solve for the price of gas.
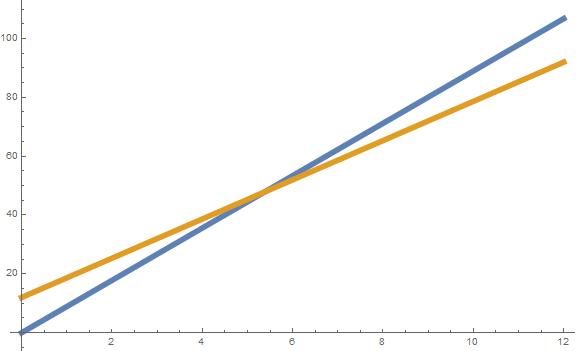
Plot of y = 8.889x (blue) and y = 6.667x + 12 (orange).
Note: x axis shows price of gas; y axis shows total delivery costs.
It stands to reason that the additional $12 fixed cost creates an overhead situation. That’s why the orange line starts on the graph $12 higher than the blue line. If gas could be purchased at $0 a gallon, all the large truck would have to pay would be the docking fee ($12) and the small van wouldn’t have to pay anything. Eyeballing the graph, I see it will cost more to use the small van only if gas costs more than about $5.50 a gallon.
We can, of course, determine the exact point at which it will become more expensive to use the small van and skip the $12 fixed fees but buy more gas. The two graphs intersect at the point where

Remember, in our model, x is the price of gas in dollars per gallon.


So, a little less than my eyeball estimate of $5.50, so I conclude my answer makes sense. If gas is more expensive than that, it will be better for the company to use the large truck to make the deliveries and pay the extra $12 fee for docking, because the truck won’t have to return to the distribution center each time and guzzle all that extra gas.
Rounding differences
Note that the price for gas I found in part B differs from that shown on the PARCC scoring guidelines for this problem. Instead of keeping exact numbers, PARCC rounded to the nearest tenth in the models used for part A. That gave them an answer of $5.45 in part B, which is just as correct as mine, given that PARCC rounded.
They did all the right computations in their work and justification and executed them without error. Rounding is not an error, but it resulted in a difference in the exact number of 5 cents.
A lot was being made a few years ago about how “Common Core math” seemed to say several different answers would be considered correct, as long as they were justified properly, given the correct mathematics. That didn’t sit very well with some parents, who also thought everything we teach third graders through high school students has to meet the exacting standards of a graduate engineering student. This problem is a prime example of where an answer of $5.45 can be just as acceptable, and earn the student just as many points, as $5.40.
On a multiple-choice test, the two different answers would never be available to students, and on a constructed response question like this one on the PARCC test, the student gets most of the points on this problem for the modeling and the justification, not for the correct numerical value for the price of gas.